The topology component enables you to display a parent/child hierarchy in a left-to-right rendering, as shown in the following video.
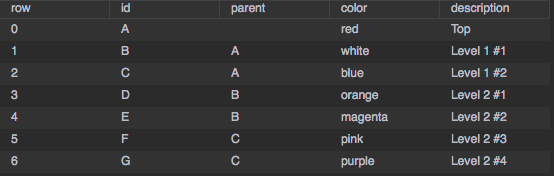
The following figure shows the table containing the data for the topology shown above.
To implement this example:
| Property name | Bound from... | Description |
|---|---|---|
| Data | The entire table | Table in dataflow containing the node hierarchy and display settings. |
| Id Field | id | Table column containing ID of the node |
| Parent Field | parent | Table column containing ID of the parent of the node. Blank if the node is a top-level node. |
| Name Field | name | Table column containing the name to display next to the node. |
| Color Field | color | Table column containing the color of the node. |
By default, the topology component displays nodes as small circles. You can create a symbol to be displayed for nodes; for example:
Now set the topology's Symbol property to "node". If you have configured the bindings correctly, the parent node is displayed. To expand it, click it.