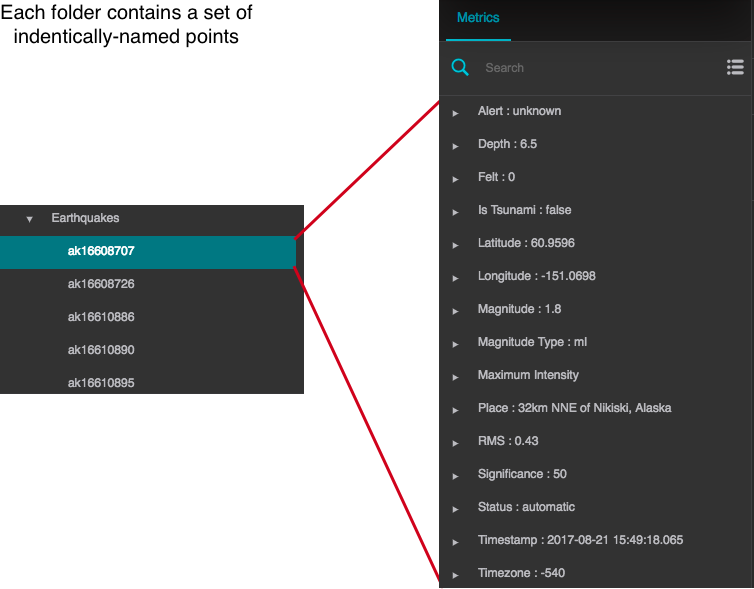
Relativization is the use of a single graphic to display data from a set of identical devices or entities. Data for similar or identical devices is typically organized
into a set of folders, and both the folders and points are named using a consistent naming scheme. For example:
Videos
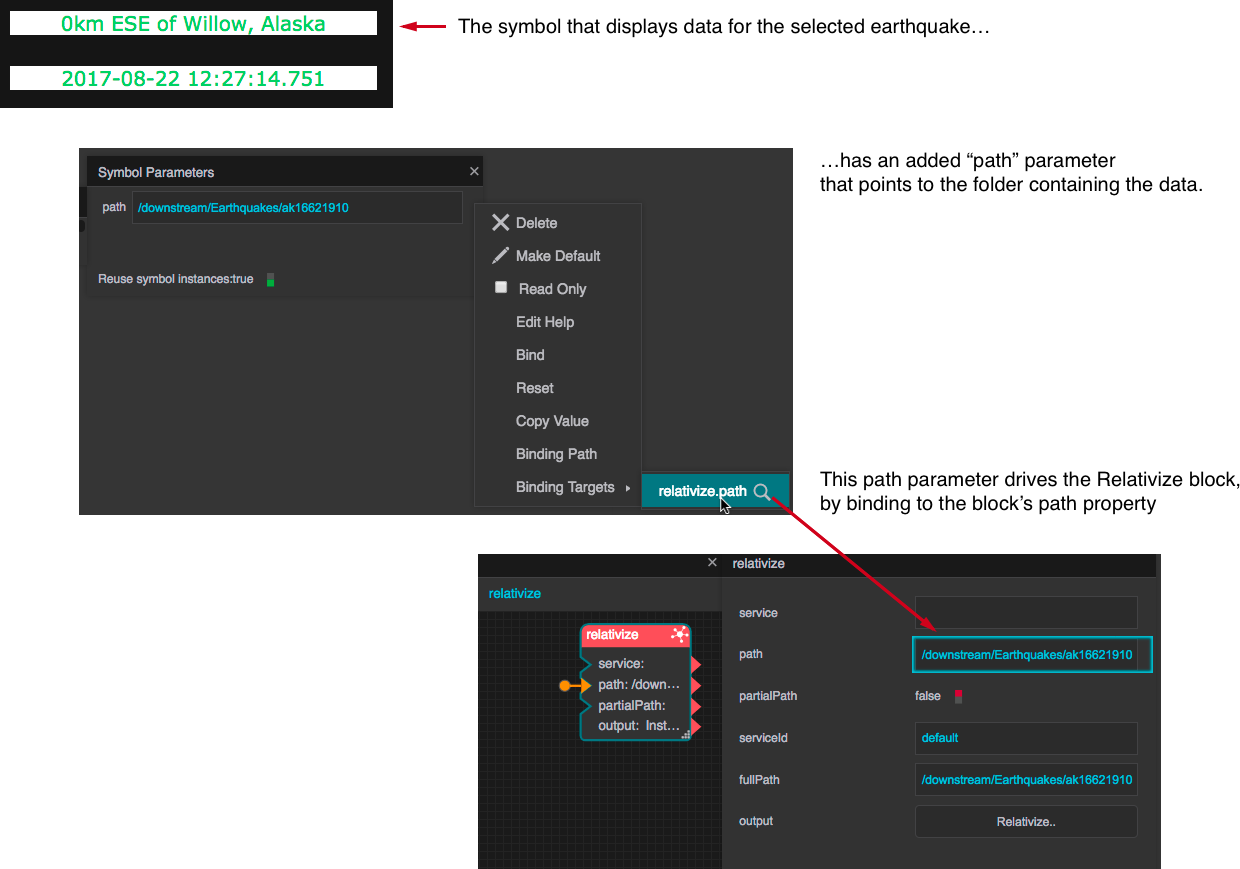
Relativization takes advantage of the naming scheme by decoupling the parent folder from the points - the point names remain constant and only the parent folder is changed. To display the data, you create a symbol containing elements that are bound to the points of interest, then add a path parameter for the parent folder setting. The following figure shows the configuration.
Example
To implement the preceding example, perform the following steps.
Add text fields to the stage, one for each data point that you want to display, and style as desired.
Select a folder under the Earthquakes folder and drag the desired points from the metrics window to the text fields.
Select all the text fields and group them.
Open the group's dataflow and add a Relativize block. Set its path parameter to the path of the folder containing the points that you bound to the text fields. (Shortcut: Drag the folder from the Data pane to the path property field.)
Click the block's Relativize button, click Select All, then click Relativize. Save your changes.
Convert the group to a symbol.
Edit the symbol and add a string parameter named "path".
Bind the newly-added path parameter to the Relativize block as follows:
In the Properties pane, mouse over the space to the right of the path property, click the blue dot that appears, and choose Bind. The binding popup for the path property is displayed.
Right-click the group (which is now a symbol) and choose Edit Symbol.
Open the symbol dataflow and select the Relativize block. The block properties are displayed in the right pane.
To bind from the path property of the symbol to the path property of the block, drag the blue dot from the binding popup to the block's path property.
Close the dataflow and the binding popup and exit symbol editing mode.
To verify that the symbol is now relativized, set its path property to any of the folders that contain earthquake data points. If you have correctly configured the bindings, the text fields update to display the data from the specified folder.
The symbol's path parameter controls the data that is displayed by the symbol. Rather than setting the path manually, you can bind it to a list of the folders containing point data, so users can select from the list. To create the list, perform the following steps:
To add a drop-down list, right-click the Stage and choose Insert > Form > List.
Open the list's dataflow and drag the Earthquake folder from the Data pane to the dataflow.
Add an Aggregation block to the dataflow and configure it as follows
Bind its input from the output of the Earthquake block.
Set its column property to "path".
Set its method property to "concat".
Bind its output property to the Options property of the list (in the Properties pane). If you have configured the settings correctly, the list is populated with the paths of the folders containing earthquake point data.
Finally, bind the Value property of the list to the path property of the symbol that displays the data.
To verify that the settings and bindings are correct, go into Preview mode and choose a path from the drop-down list. The fields in the symbol update to display the data for the selected path.